
Statistics involve a lot of higher-order math skills that don’t always come easy to learners. Probability, mean, median, and mode are also skills that students need to learn in order to develop a good foundation for statistics. Additionally, students have to study statistics over a period of time in order to practice the skills and prepare for more difficult math concepts at a later stage. The variety of activities below will help them prepare in the best way possible! Here are 35 stellar statistics activities for all grade levels.
1. Use Classroom Data

This classroom activity encourages elementary students to collect their own information using classroom data. Then, students can analyze the data and plot it using a dot plot, box plot, or bar graph.
Learn More: Lindsay Bowden Blog
2. Statistics Bingo
Statistics bingo is a fun way to gamify learning about data tracking and plotting. This variation of Bingo gets kids up and moving throughout the classroom. Students have to find the data set posted around the room that satisfies each bingo box.
Learn More: Teacher ACER
3. Tongue Twister Scatter Plot
Students work in groups of six and each learner is assigned a role. The students read the tongue twister and time how long it takes using stopwatches. Each time, the timers take the average of the two times and then plot it on a scatter plot.
Learn More: Sing and Learn
4. The “Blind Stork” Test

Students must work in pairs for this fun activity. One student stands on one leg and closes their eyes while the other student times the period of time that they can stand like a blind stork. Then, as a class, they enter the data on a shared sheet. This compiles the data for the class to manipulate for a variety of activities.
Learn More: Edutopia
5. Statistics Olympics

Students complete challenges to compile data and draw meaningful interpretations from the data. Classes compete against each other to complete the challenges. From the data, students extrapolate mean, median, and mode as well as more complicated concepts like standard deviation.
Learn More: Edutopia
6. Coin Toss Probability

Students will work in pairs or small groups to complete a coin toss experiment. They toss the coin and record heads or tails for each toss. Then, students calculate the probability of tossing heads and the probability of tossing tails.
Learn More: Number Dyslexia
7. Candy Recreation

In this statistics collection activity, kids get to eat candy, but they must then use the wrappers to gather data. Students will read the nutrition labels and compile data from different candies. Then, they can use the data to make circle graphs, box plots, or line graphs.
Learn More: Number Dyslexia
8. Choosing the NBA All-Star Team

This activity is a real-life application of statistics in order for statistics students to pick the NBA All-Star team. Students will look at each player’s statistics and then decide who should and shouldn’t be on the team; explaining their reasoning in relation to the analyzed stats.
Learn More: Yummy Math
9. Play S.N.A.K.E.

In this dice game, each student needs a piece of paper and the teacher needs two die. Students either take the sum of the die as their score and go out for the round, or they keep pushing and adding the next roll to their score. If two ones are rolled, the students are out.
Learn More: The Average Teacher
10. Roll and Tally

This is a simple way to teach probability and statistics. The teacher will roll the die and the students will tally the results of each roll; paying attention to the number of times each digit is rolled. Over an extended period, students will observe that the tallies even out.
Learn More: The Average Teacher
11. Super Bowl Statistics
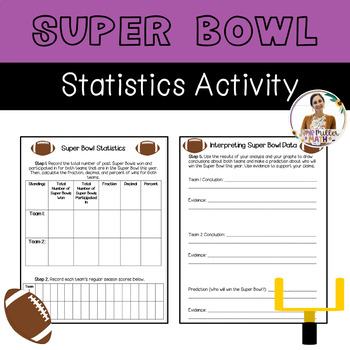
This is another fun activity that applies statistics to the real world. The students will look at Super Bowl statistics and then draw conclusions based on the data. After looking at the data and analyzing the statistics, students predict who will win the Super Bowl.
Learn More: Teachers Pay Teachers
12. Water Bottle Flip STEM Challenge

This experiment has kids use the scientific method to collect data using the popular bottle flip challenge. Students will collect their data and then work on calculating probability using fractions. Students then display their findings using graphs.
Learn More: Teachers Pay Teachers
13. Game of Chance

This card sort activity encourages students to think about how to “level the playing field” using their knowledge of probability and statistics. Kids will work in pairs and see how a game can begin unfairly and become more equal if the gameplay is altered.
Learn More: Education.com
14. Play Advanced Monty Hall
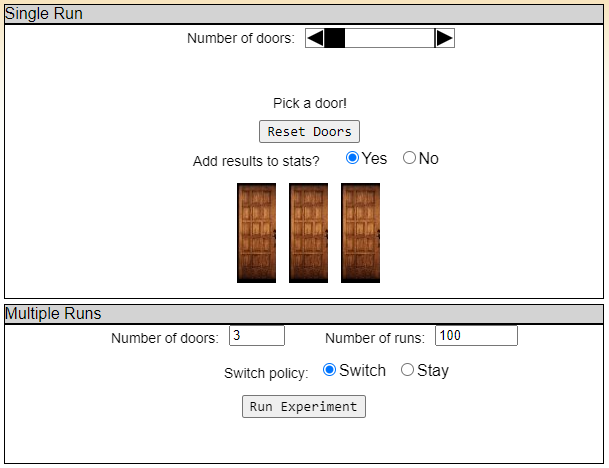
This interactive statistics game is very similar to Deal or No Deal. Students will select a door and decide whether or not to keep an item behind the door or select the next door. The goal is to find the money symbol.
Learn More: Interactivate
15. Greedy Pig Game

Students will roll the pig die and decide if they want to push their luck. Students can roll as many times as they want, but when a “1” is rolled, they lose all their points, and the round is over.
Learn More: Math Equals Love
16. Capture-Recapture
In this hands-on statistics game, students will try to estimate the number of cards without actually counting them. Students will draw fourteen cards and then do a capture/recapture study to look at another sample of cards. Then, they will compare the data and estimate the number of cards.
Learn More: RoyalStatSociety
17. How Random Are You?
In this demonstration, students will learn how “random” they are. They will pick a number between 1 and 6 and then roll a die. Students will compare the dice throws to the number of times individuals chose specific numbers.
Learn More: Seeker
18. Describing Shoe Distributions

PBS explores how New Balance uses data as part of its production process. The company decides how many shoes to manufacture based on data from the previous year. Students will study a graphical representation of the data to determine how many shoes to produce.
Learn More: PBS
19. Low and High-Paying Jobs
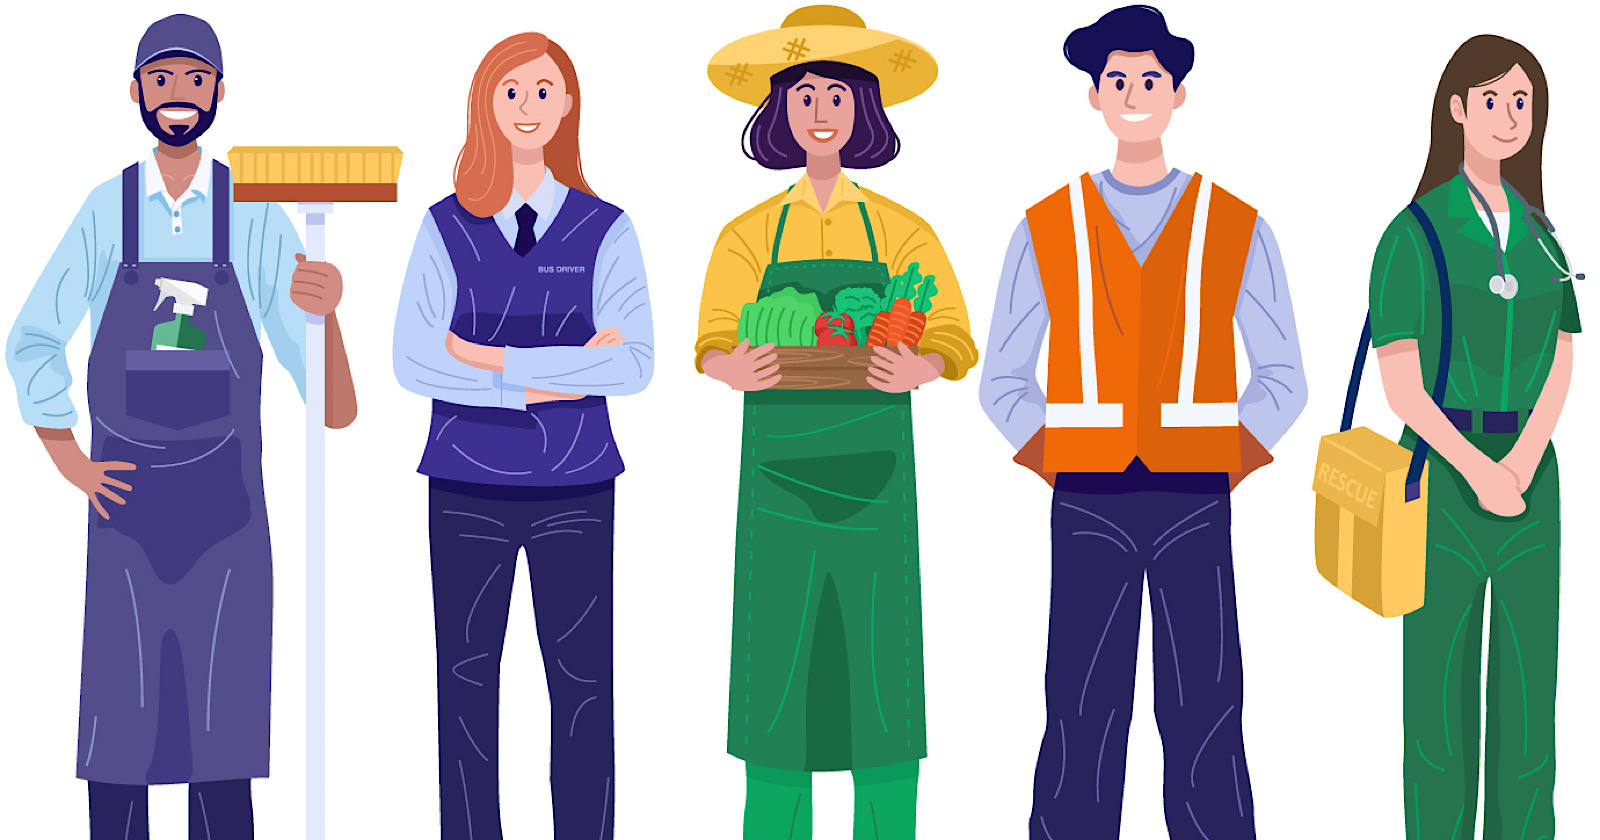
This eye-opening activity has students looking at statistics surrounding the United States’ highest and lowest-paying jobs. Students analyze box plots to see how wide the disparity between jobs really is.
Learn More: PBS
20. He Said, She Said

In this activity, students will look at box plots and two-way tables. They have to justify their answers and use critical thinking to explain the data in their groups. They will use the “he said, she said” method to explain their peer’s thinking and findings.
Learn More: Maneuvering the Middle
21. Human Stop Watch Variability

In this lesson, students will practice stopping a stopwatch and recording how close or far off they are from a target. After collecting the data from the physical activity, students will then analyze the variability of the data using circle graphs.
Learn More: Desmos
22. Strength in Numbers

In this lesson, students will make estimations three times. After each student estimates, they will see a dotted box of their peers’ estimations and then create an action plan of whether to increase or decrease their own estimation.
Learn More: Desmos
23. Yahtzee and Probability

In this statistics lesson, statistics students play Yahtzee and determine the probability of each roll in order to make the best decisions in the Yahtzee game. Students will enjoy a game while also practicing their statistics skills!
Learn More: Cornell
24. Analyzing Relationships

In this activity, statistics students analyze the marriage and divorce rates for men and women in the United States. Students will plot the data using a linear graph and will then explore the meaning of outliers in a data set.
Learn More: United States Census
25. Comparing Populations

This math activity encourages students to practice using scatter plots and scientific notation. Students will compare populations and express ratios using scientific notation. They will then create a scatter plot.
Learn More: United States Census
26. Paper Drop

This activity is great for elementary students! Students will drop a heavy piece of paper and a light piece of paper- attempting to reach a target. Then, they will record how closely the paper landed to the target. Students will analyze how density affects accuracy in this fun activity.
Learn More: Tinker Plots
27. Men’s 100-Meter Dash

In this lesson, students will analyze data over a period of time. Then, they will analyze that data to make predictions. Students will look at how gold medal performances have changed over time.
Learn More: Tinker Plots
28. Gumball Probability

Students will analyze the probability of different colored gumballs produced by a gumball machine. They will analyze how sample size impacts data interpretation and how variation can impact data and statistics.
Learn More: STEW
29. Spinners at the School Carnival

Students will use a carnival spinner to conduct an experiment and assess the probability of specific outcomes. They’ll organize the data into tables and graphs and then make predictions based on the information they have collected.
Learn More: STEW
30. Fingerprint Types

This lesson uses beads to simulate the distribution of fingerprint types in the United States. Students draw beads from a bag and calculate the proportions of fingerprint types using the random sample. Students will come to realize that random sampling can impact statistical data.
Learn More: Statistics Teacher
31. Investigation of Categorical Data

In this statistics activity, students will explore how numerical data and categorical data need to be analyzed differently. They’ll develop a statistical question based on survey questions. Then, they’ll collect data, analyze it, and report back to the class.
Learn More: Statistics Teacher
32. What’s Going On In This Graph?

Graphs can be difficult to interpret and this lesson helps kids better explain what a graphical representation of statistical data looks like. Students must look at a variety of graphs and explain the conclusions that can be drawn from them.
Learn More: New York Times
33. Average Smile

This is an interactive activity that students can do online. They’ll look at “smile” scores and determine the mean, median, and mode of the data. They can then manipulate the smiles and put the data in order to analyze the numbers more.
Learn More: Transum
34. Weather Math

This is another interactive website that provides weather data for students to manipulate and interpret. The site also includes data-related questions in order to get students thinking in a more in-depth way.
Learn More: Transum
35. Probability Read-Aloud

There are so many math-y books that give elementary students a foundation for important math concepts like probability and statistics. This read-aloud is perfect to get kids interested in math and ready for a new unit!
Learn More: Alyssa Teaches
 20 Marvellous Microscope Activity Ideas